

In business, intuition and guesswork only get you so far. Data-driven decisions get you further.The good news is that there’s plenty of data out there—and there’ll be even more tomorrow. In fact, the amount of data created online has grown from 18 zettabytes in 2016 to a predicted 118 zettabytes in 2023.
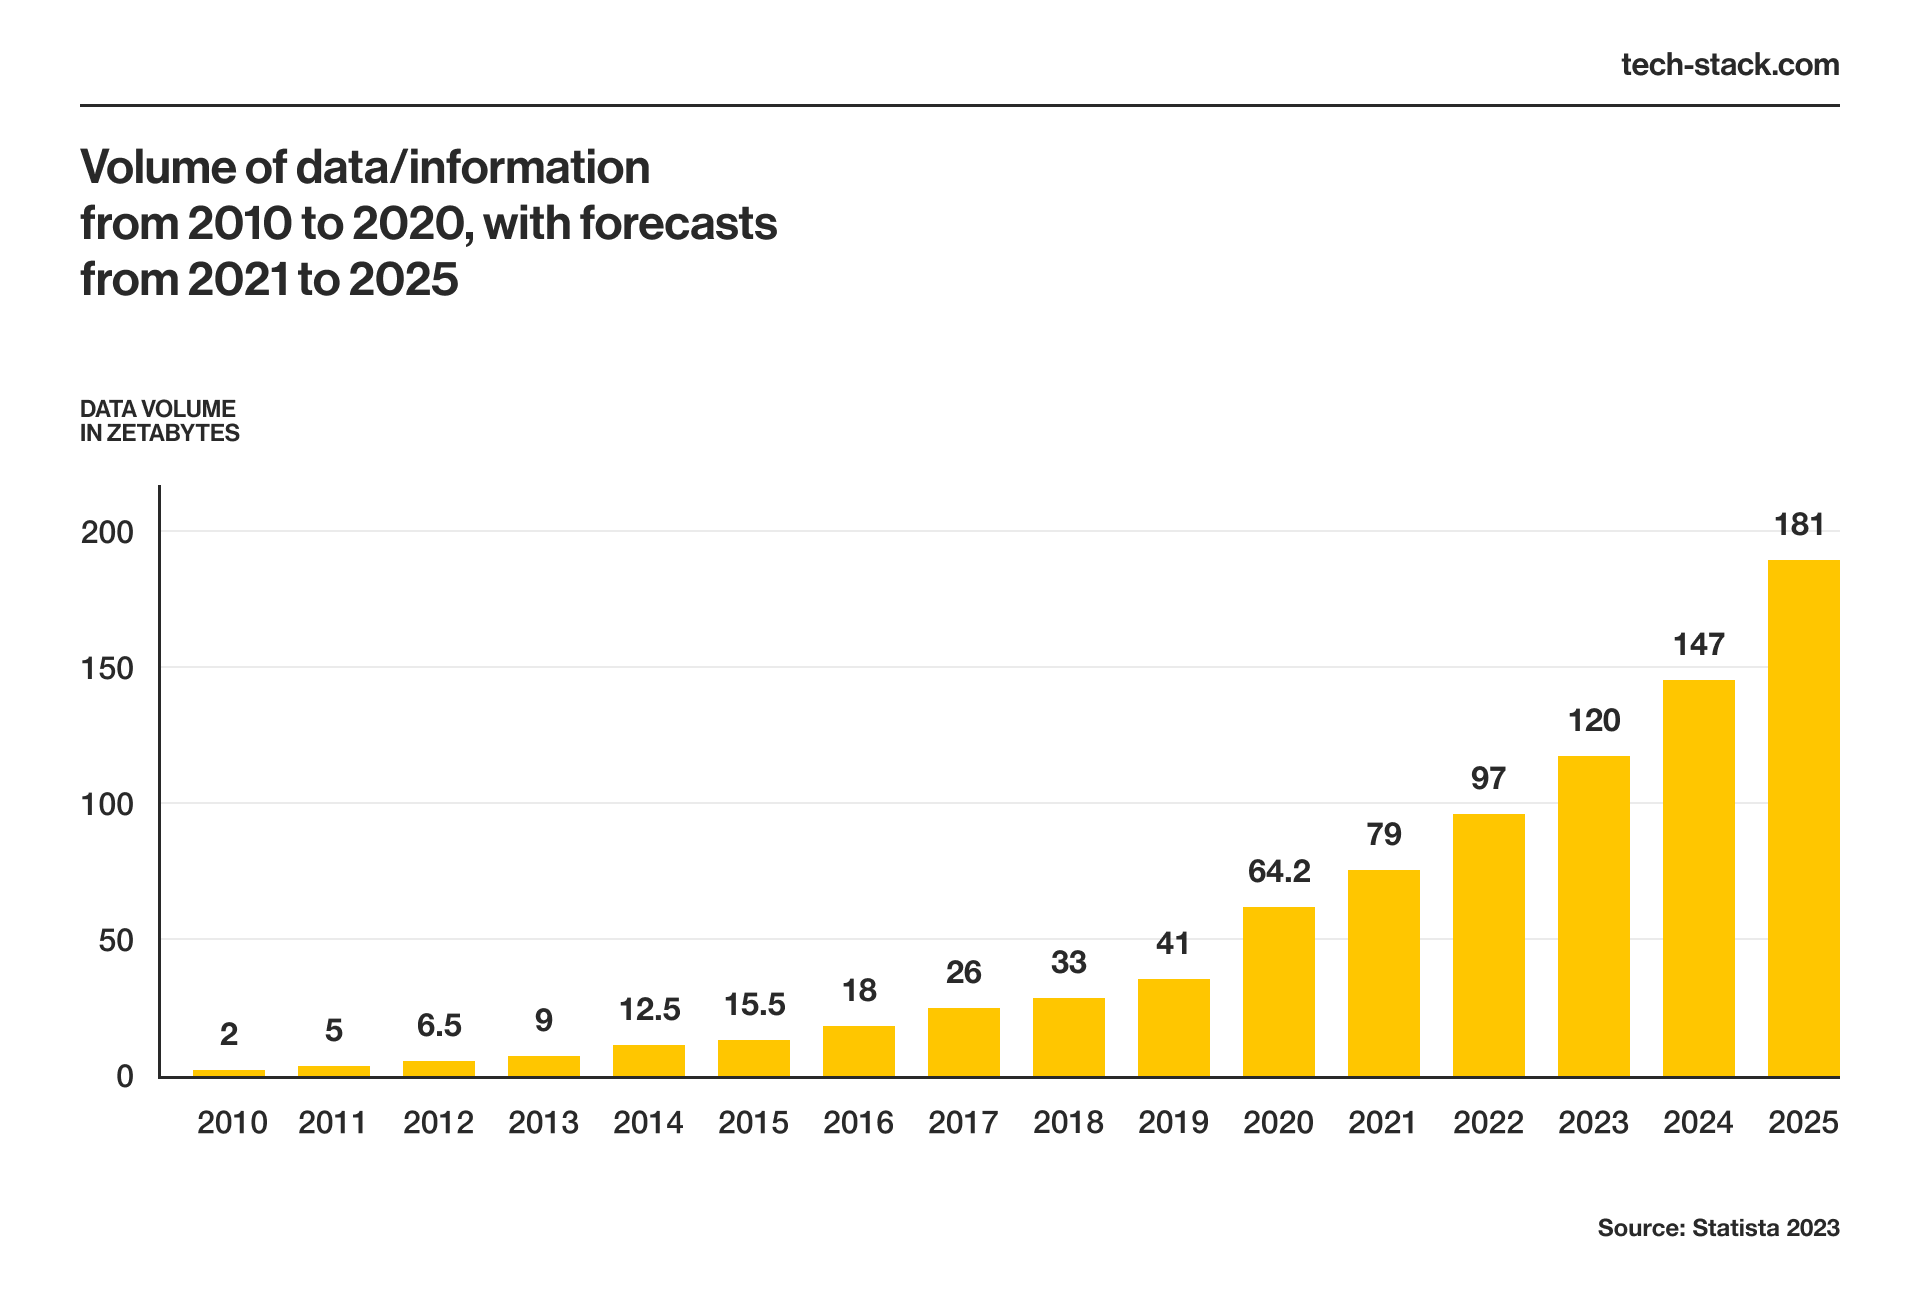
Just for context, one zettabyte is one trillion gigabytes — enough for a staggering two trillion hours of video streaming or downloading 200 trillion songs. While you might not need all that, you still have to pay attention: to get insights into your operations and the industry as a whole, it’s probably time you joined the big data revolution.
Big data is especially useful for business development and marketing, as it helps companies learn more about their customers and their needs, conduct market research, and optimize business processes.
But the big data benefits don’t stop there. Industries such as e-commerce and retail, manufacturing, logistics, finance, and the energy sector have all found interesting ways to leverage the insights in the data they collect and process daily.
Before we look at what big data could hold for you, let’s clarify what the term means.
How Big is Big Data?
First and foremost, big data is really big: think of data measured in petabytes (more than 1 million gigabytes) and exabytes (more than 1 billion gigabytes). Compare these numbers with the data we consume daily: one hour of a Netflix movie in high definition takes no more than 3 gigabytes of data.
Big data can be accessed through publicly-available sources—for example, industry reports—or it can belong to your company in the form of customer emails and financial statements.
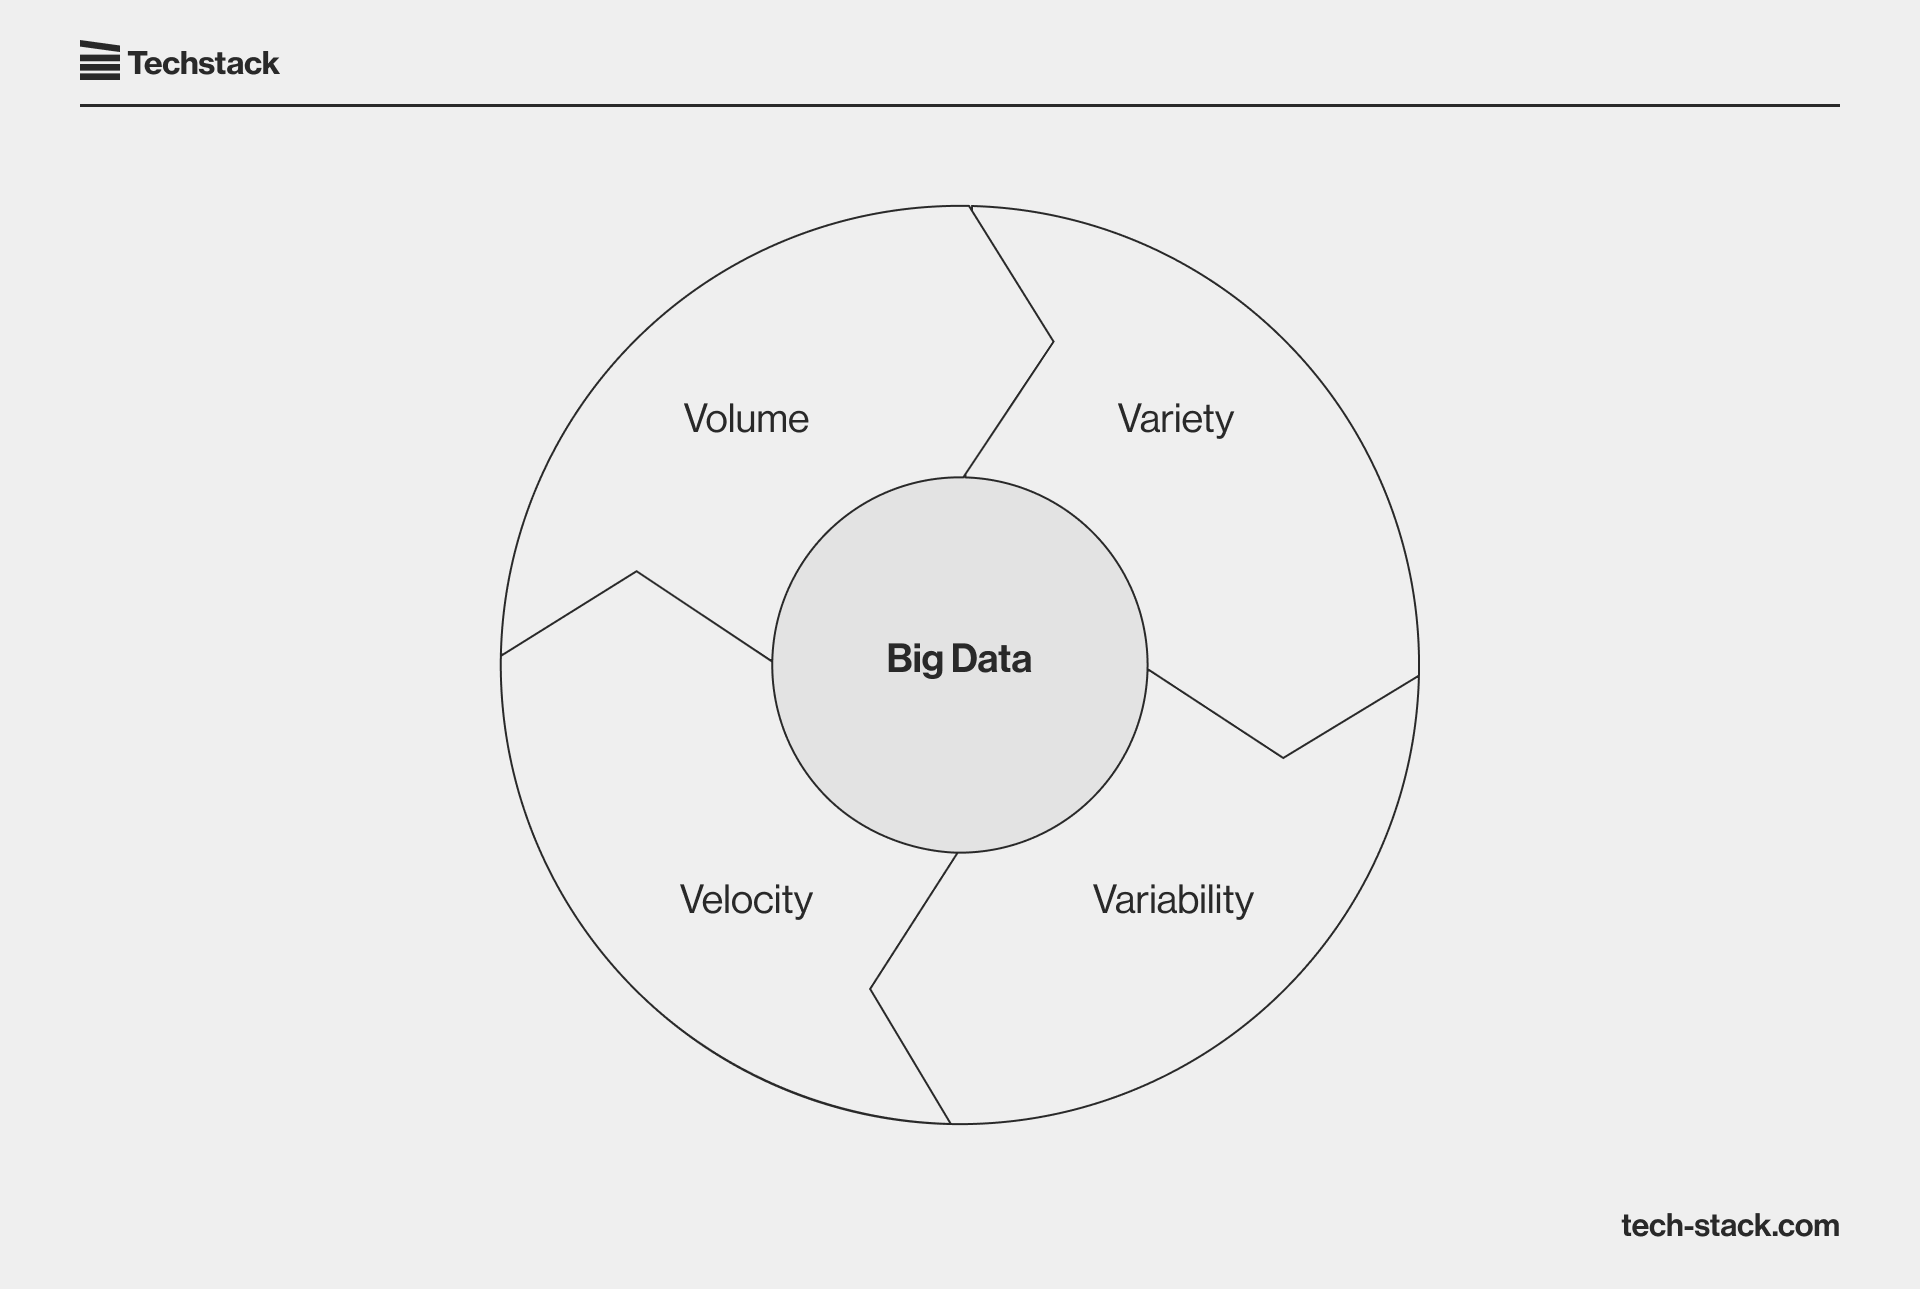
In a nutshell, big data is characterized by four Vs:
- Volume: As we’ve seen, big data is a large amount of information.
- Variety: Big data also comes in various formats, such as audio or video files, sensor data, questionnaires, emails, etc.
- Velocity: Big data is generated and arrives for processing at high speed.
- Variability: Data in a big data pool changes over time and may include inconsistencies. For example, an organization may gather new user data daily, and the underlying data pool will therefore change.
Now that it’s clear what big data is, let’s understand how industries use it to gain a competitive advantage.
How Different Industries Use Big Data to Improve Decision-Making
Big data provides a window into how business processes work and how customers interact with companies. As such, analyzing big data helps companies make research-based, informed decisions to develop their business, optimize resources, and better meet customers’ needs.
Virtually any industry that generates a lot of data can find a use for big data analytics, but some domains have taken the lead in exploring the benefits. If you’re in any of the industries below, chances are your competitors are already working with big data.
E-commerce and retail
E-commerce and retail companies use big data to study their market and competitors to identify industry trends and opportunities.
A massive part of big data applications in e-commerce is customer research. Companies collect demographic data, purchase history, popular product pages, and user journey information on their websites and apps to improve their marketing strategies, adjust pricing, and give intelligent recommendations.
Healthcare
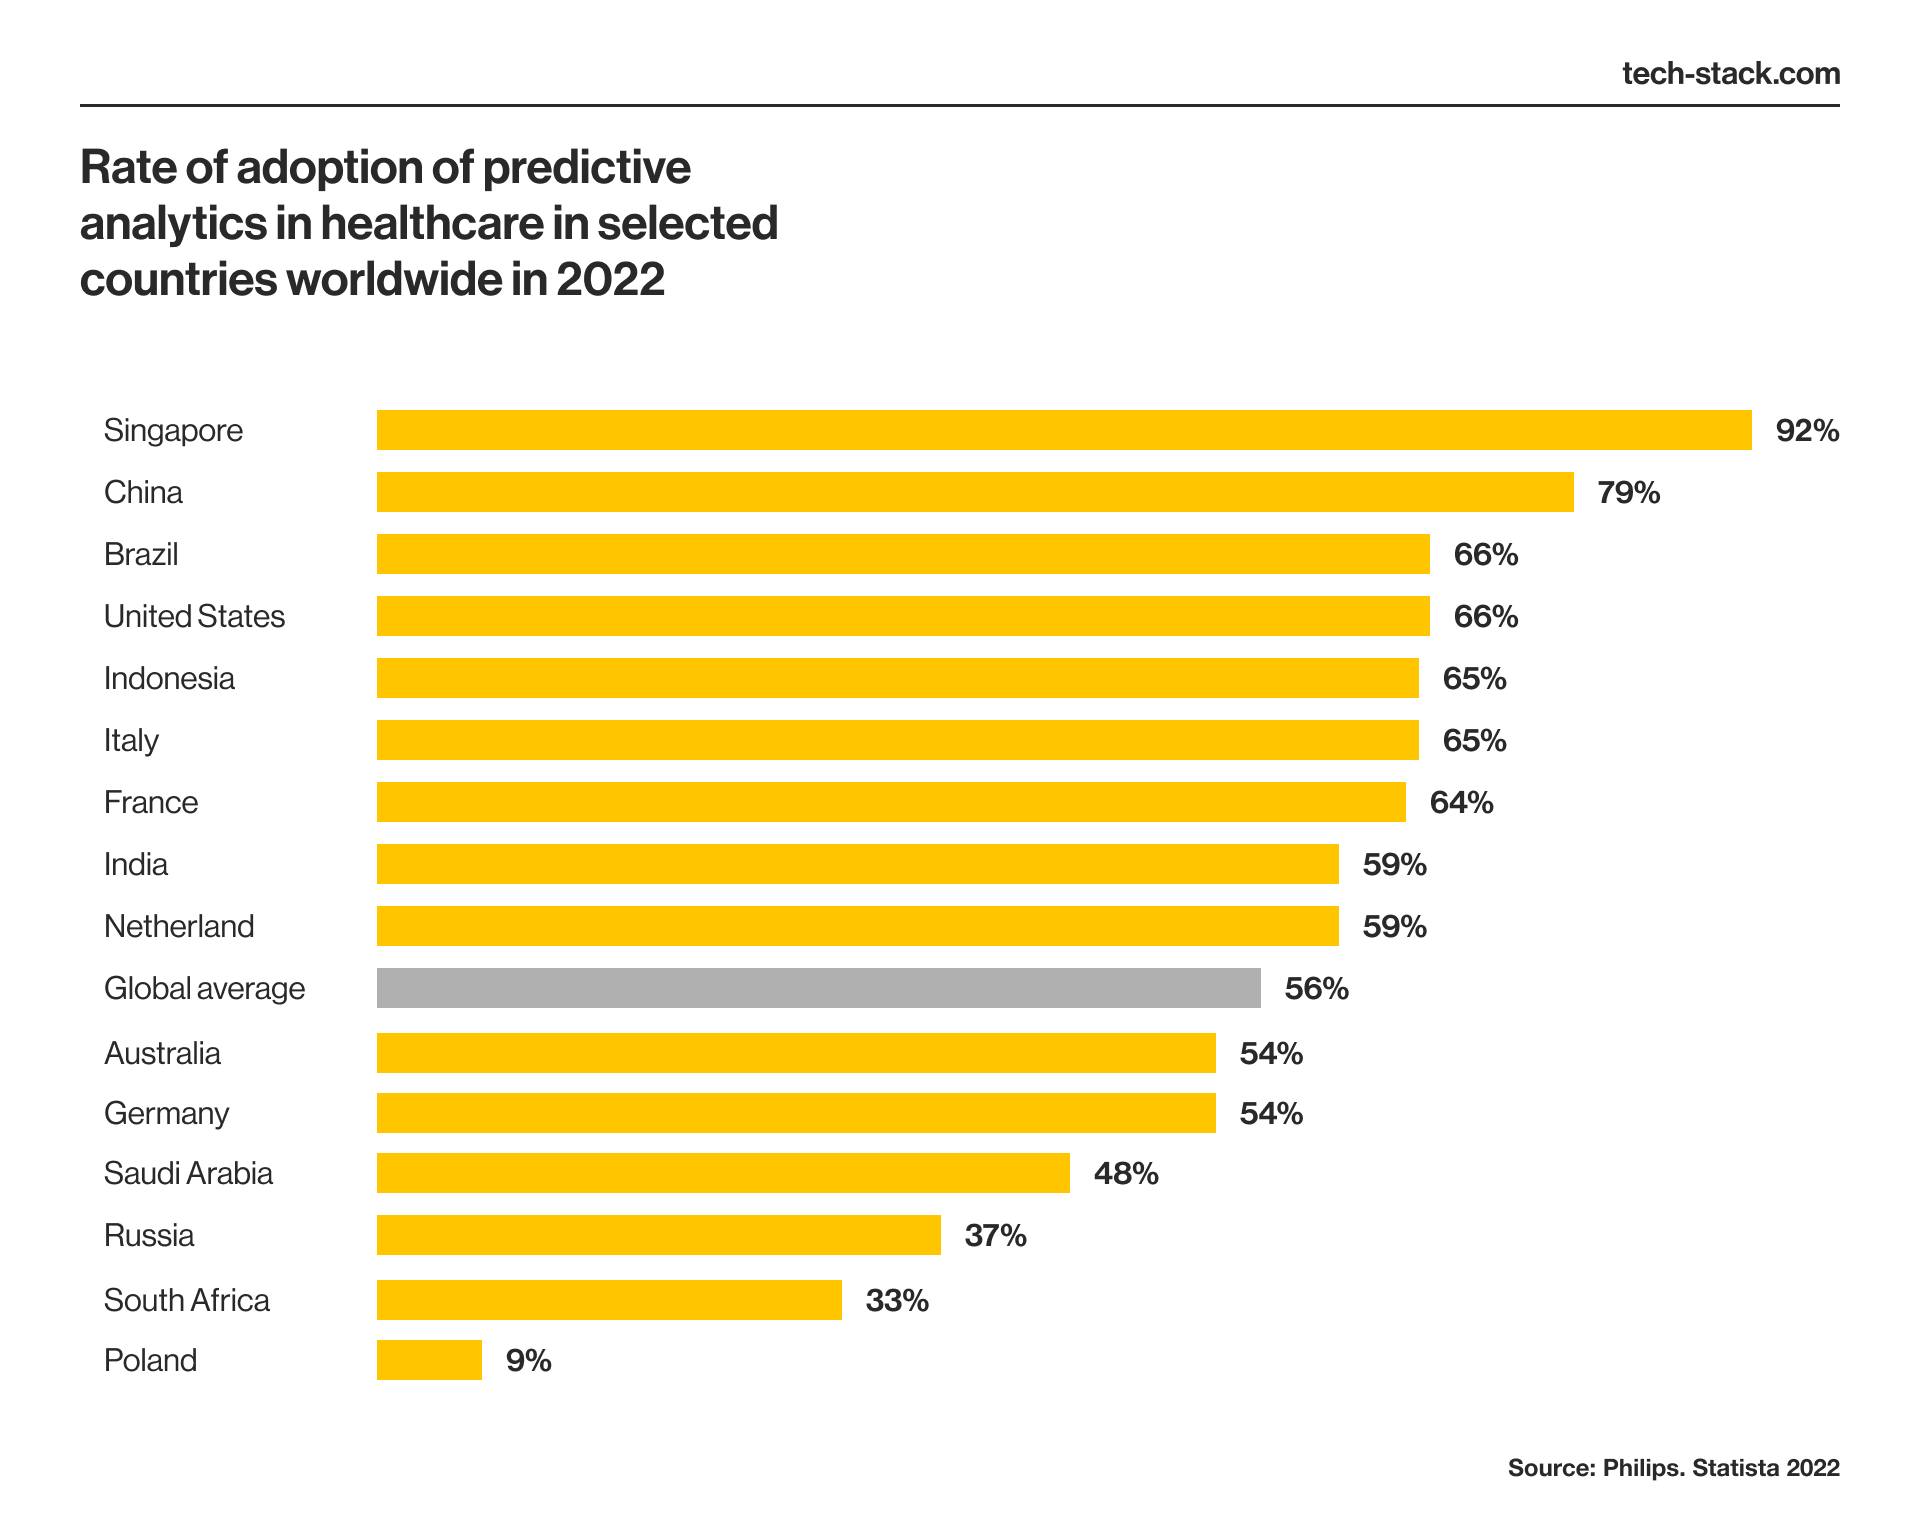
In healthcare, big data has wide use in predictive medicine. 2022 research shows that 56% of healthcare institutions worldwide have adopted predictive analytics technology.
Commercial and state health institutions use big data to detect correlations between cancer screenings and onset, giving insights into how often screenings need to be conducted to detect cases early. Additionally, big data can be used to evaluate the effectiveness of treatments based on information about previous patients.
Finally, real-time big data analytics can help in telemedicine and diagnosis. Users can track health parameters on smartwatches and share them with healthcare organizations and medical companies to identify health trends and take proactive steps.
Finance
Big data applications for the finance industry include
- Real-time stock market monitoring
- Algorithmic trading with the best possible prices and timing considered
- Investment return predictions
- Credit card fraud detection and prevention through transaction analysis
Big data’s benefits for financial institutions are palpable, since the industry highly depends on analytics. The more data is analyzed, the more precise — and profitable — decisions come out as a result.
Manufacturing and logistics
The main application of big data in manufacturing and logistics lies in supply chain management and cost optimization.
Companies can use supply chain big data analytics applications for tasks such as
- Inventory projection and risk management
- Demand predictions and effective production scheduling
- Demand and supply balancing
- Warehouse zoning and organization optimization
- Cost-efficient delivery and transportation organization
- Workload optimization
With the post-pandemic changes in logistics and supply chain disruptions, better visibility and advanced data analysis is paramount for a business’ competitiveness.
Energy sector
Big data can contribute to more efficient power generation and planning in the energy sector. More precisely, big data helps manage and predict energy demand and supply. As a result, energy companies can balance network loads more effectively, better organize supply processes, and reduce overall energy consumption.
Techstack case
Here’s a real-life example of a big data solution in this domain. Techstack implemented a solar energy data portal that collects, stores, and represents solar production energy data from solar panels made by different vendors. This big data solution collects real-time and historical data to offer insights about energy generation from the panels. As a result, vendors have direct access to solar panel operation info and can use it for resource optimization, failure prediction, and demand planning.
Haven’t found your domain among the mentioned industries? That doesn’t mean big data is of no use to you.
How to Make Your Company More Competitive with Big Data
What are the most prominent big data benefits for companies? If you ask us, it’s a competitive advantage, thanks to better market positioning and cost optimization. In fact, research shows that in 2022, around 40% of organizations worldwide were already managing data as a business asset, and about 56% were using data to drive innovation.
Let’s take a closer look at what big data collection and analysis offer to help you get ahead in the market.
User behavior insights
Big data can provide valuable information about customer preferences and behaviors, leading to insights into how customers interact with your brand.
For example, with big data, you can learn how much time customers spend exploring your website or app, how often they make a purchase, when users leave a website, and which products are the most popular. You can then use this data to discover trends and gaps in marketing strategy and improve customer acquisition and retention.
Better customer experience
You can also use behavioral insights to improve customer and user experience. For example, big data drives the “Customers who bought this item also bought” section featured on most major shopping portals. Companies gather and analyze data about viewed products and completed purchases to populate the section with products a customer is likely to be interested in.
Bringing big data to interactions like this increases personalization, improving user experience and sales rates.
Streamlined management and operations
From supply analysis to financial management, big data clarifies what’s going on in your business. As a result, a big data service can help you make more informed strategic and operational decisions.
You no longer need to review thousands of purchases, make sense of financial statements, or plow through work logs to analyze your team’s workload: big data solutions can show you how your company is doing in an easy-to-understand format.
Big data’s benefits include saving money in your day-to-day processes by optimizing the resources you spend on logistics, marketing efforts, and overstocking. For example:
- E-commerce and manufacturing companies can make more accurate demand predictions by analyzing completed purchases and seasonality and then stock accordingly.
- B2C companies can use big data-driven customer lifetime value prediction to help decide how much to invest in advertising and which customers to target.
- Companies can use marketing effectiveness analysis to ensure they’re promoting the right products in the best way possible.
Precise decisions cost you less in the long run, and big data is what improves your decision-making.
Improved cybersecurity
Real-time big data analytics lead to better fraud detection and higher levels of cybersecurity. Services such as real-time anomaly detection can help you notice suspicious logins and transactions to keep your customers safe and protect your company from data breaches.
These are just some advantages big data can offer to enhance your business. Of course, to get the most out of it, you need to choose the approaches that suit your goals best.
Best Practices for Leveraging Big Data
There are several types and some general best practices for big data analytics. Which ones you implement will depend on the purposes of your data analysis and the type of data you’re working with.
Stream analytics
Stream analytics relies on real-time data analysis and processing. Essentially, it gives you insights into your business processes on the go. Additionally, stream analytics organizes and analyzes data right away, so it’s possible to detect anomalies online and offer instant observations and suggestions.
One example of a stream analytics application for business is improving customer experience through smart recommendations.
Batch data processing
In contrast to stream analytics, batch data processing analyzes existing data batch by batch. Compared to other big data best practices, this is a more established, classical approach that works for retrospective analysis.
Micro-batch processing is a middle-ground between classical batch analysis and stream analytics. Analyzing smaller data sets more frequently brings the process closer to real-time while still operating with already existing data. Batch data analysis works well for studying business processes and highlighting trends.
Predictive analytics
Big data analytics doesn’t just allow for retrospective and real-time analysis: it can drive predictions too. For example, by analyzing typical user behaviors, big data can forecast upcoming demand for certain products. Analyzing the current market state, marketing data, and financial reports can also assist with risk prediction.
Predictive analytics can be based on both historical data and real-time data processing. Systems use deep learning and machine learning to detect patterns and make predictions.
Sensor and log data processing
If your business works with IoT, big data can give you a host of useful information about device operations. Collecting data from device sensors and logs can help you optimize work by redistributing resources, detecting anomalies, understanding how users interact with devices, and anticipating possible mechanical failures. Retrospective (descriptive), real-time, and predictive analytics are all data best practices used in IoT data analysis.
Having looked at possible big data applications, let’s take a peek under the hood of big data analytics to understand how raw data is turned into reports and services.
Big Data Technologies and Tools
Collecting and analyzing data is a complex process with four main stages. Different tools help at each stage.
Data ingestion tools
Data ingestion is the first step in a big data processing pipeline. This is the process of retrieving data from various sources and moving it to an accessible environment for storage and manipulation. Data can come in a wide range of formats and include emails, social media comments, financial reports, data from IoT devices, and so on.
Usually, data is ingested (extracted) using dedicated APIs. Data can be retrieved in batches (for retrospective analysis) or in real time at a predefined frequency. At this point, data can be structured, semi-structured, or unstructured. Tools commonly used for data ingestion include
- Amazon Web Services tools, such as Amazon Kinesis Data Streams, AWS Database Migration Services, and AWS Transfer Family
- Services by Azure like Azure Data Explorer and Azure Data Factory
- Google Cloud solutions: DataFlow, DataFusion, and Dataproc
- Independent solutions, e.g. Stitch and Fivetran
Data processing tools
Data ingestion results in large volumes of data that must be sorted, organized, encrypted, and analyzed to provide insights. Data processing involves removing duplicate or invalid data, structuring the information in a standard format, and analyzing patterns. Common tools include
- OpenCV and NumPy for computer vision
- TensorFlow 2, Keras, Tflite, and scikit-learn for deep learning and machine learning
- Jupyter Notebook and Vertex AI development environments
The choice of data processing tools depends on the purpose of the data analysis and the volume and specifics of the data sets.
Data storage tools
The next step after data processing is data storage. There are two ways to store data:
- If data is already structured for reporting, it’s kept in a data warehouse, which stores sorted data for a particular purpose.
- If the data is raw and unstructured, the storage is called a data lake. Usually, such raw data is used for machine learning.
Often, data is uploaded to cloud storage such as AWS (S3, Redshift), Google Cloud (BigQuery, Cloud Storage), Azure (Data Lake, Synapse), and Snowflake, as these are secure and easy-to-manage tools. Relational databases are another option.
Data visualization and advanced analytics tools
Data visualization tools make it easy to interpret processed data and track trends. Platforms such as Power BI, Periscope Data, Tableau Desktop, Oracle Visual Analyzer, and Sisense can turn data sets into clear reports that businesses can use to present their knowledge.
Techstack works with all the tools mentioned above to lead data through all stages.
Conclusion
Big data refers to large volumes of data from various sources, from voice transcripts to social media posts. All this information can be analyzed to gain valuable insights for your business, establish trends, and predict future events.
Big data’s impact on business is huge: when processed correctly, big data’s benefits include generating observations about user behavior for marketing and sales purposes, optimizing management and supply chain systems, cutting costs, improving the customer experience, and enhancing cybersecurity.
There are several approaches to big data analysis, from real-time analytics to making predictions based on historical data. With a reliable and experienced team and a correctly chosen approach and tech stack, you can experience the benefits of big data yourself.
The Techstack team is open to new big data collaborations. We’re a software engineering company with a passion for helping companies of all sizes develop complex solutions and streamline the development process. Let’s power up your business with insights never discovered before!


